Train Your First Model Using Azure Machine Learning Studio


Welcome to my tutorial/blog on training your first model using the Microsoft Azure Machine Learning Studio.
We will be tackling the following questions:
- What is the Microsoft Azure Machine Learning Studio?
- How to create a workspace for Machine Learning Studio from Azure?
- How to train a model in Machine Learning Studio?'
1. What is the Microsoft Azure Machine Learning Studio?
Microsoft Azure Machine Learning Studio is a workspace that allows you to interactively create predictive analysis models using datasets and analysis modules. The whole building process for the model can be done through drag-and-drop, no coding required. You can also publish your predictive experiment to the Gallery as a web service once it is completed. An experiment consists of datasets and modules; dataset being a collection of data that has been uploaded to Machine Learning Studio and module being an algorithm that you can perform on your data. A common experiment consists of the following steps: preprocess data, analysis/reduction, extract/enrich features, test, train, score and evaluate.
2. How to create a workspace for Machine Learning Studio from Azure?
Login your Azure Portal, create a new Machine Learning Studio Workspace resource. Enter the name and resource group for your new workspace, and choose pricing tier. For this experiment, you could simply select DEVTEST Standard (the free one). I usually leave the other fields as default, but you can change it according to your needs. Okay, after the workspace is done deploying, select the new workspace and Launch Machine Learning Studio, this redirects you to the Microsoft Azure Machine Learning Studio platform. Under Experiments select New and you can start a blank experiment or open a sample one from Microsoft. If you wish to create an experiment from scratch, select a blank experiment and read on!
3. How to train a model in Machine Learning Studio?
We will be exploring 5 years of historical hourly weather data from New York, you can download the data from Kaggle :
Upload each dataset (you can leave out city_attributes.csv and weather_description.csv) in NEW -> DATASET.

In your blank experiment, under Saved Datasets -> My Datasets, simply drag-and-drop all the new datasets onto the experiment canvas.
 
Since we are using data in New York only, data preprocessing is needed. Right-click any of the datasets and do

Since we are using data in New York only, data preprocessing is needed. Right-click any of the datasets and do dataset -> Visualize, you’ll see the content as well as frequency histogram of each column. For data preprocessing, we can do 4 steps:
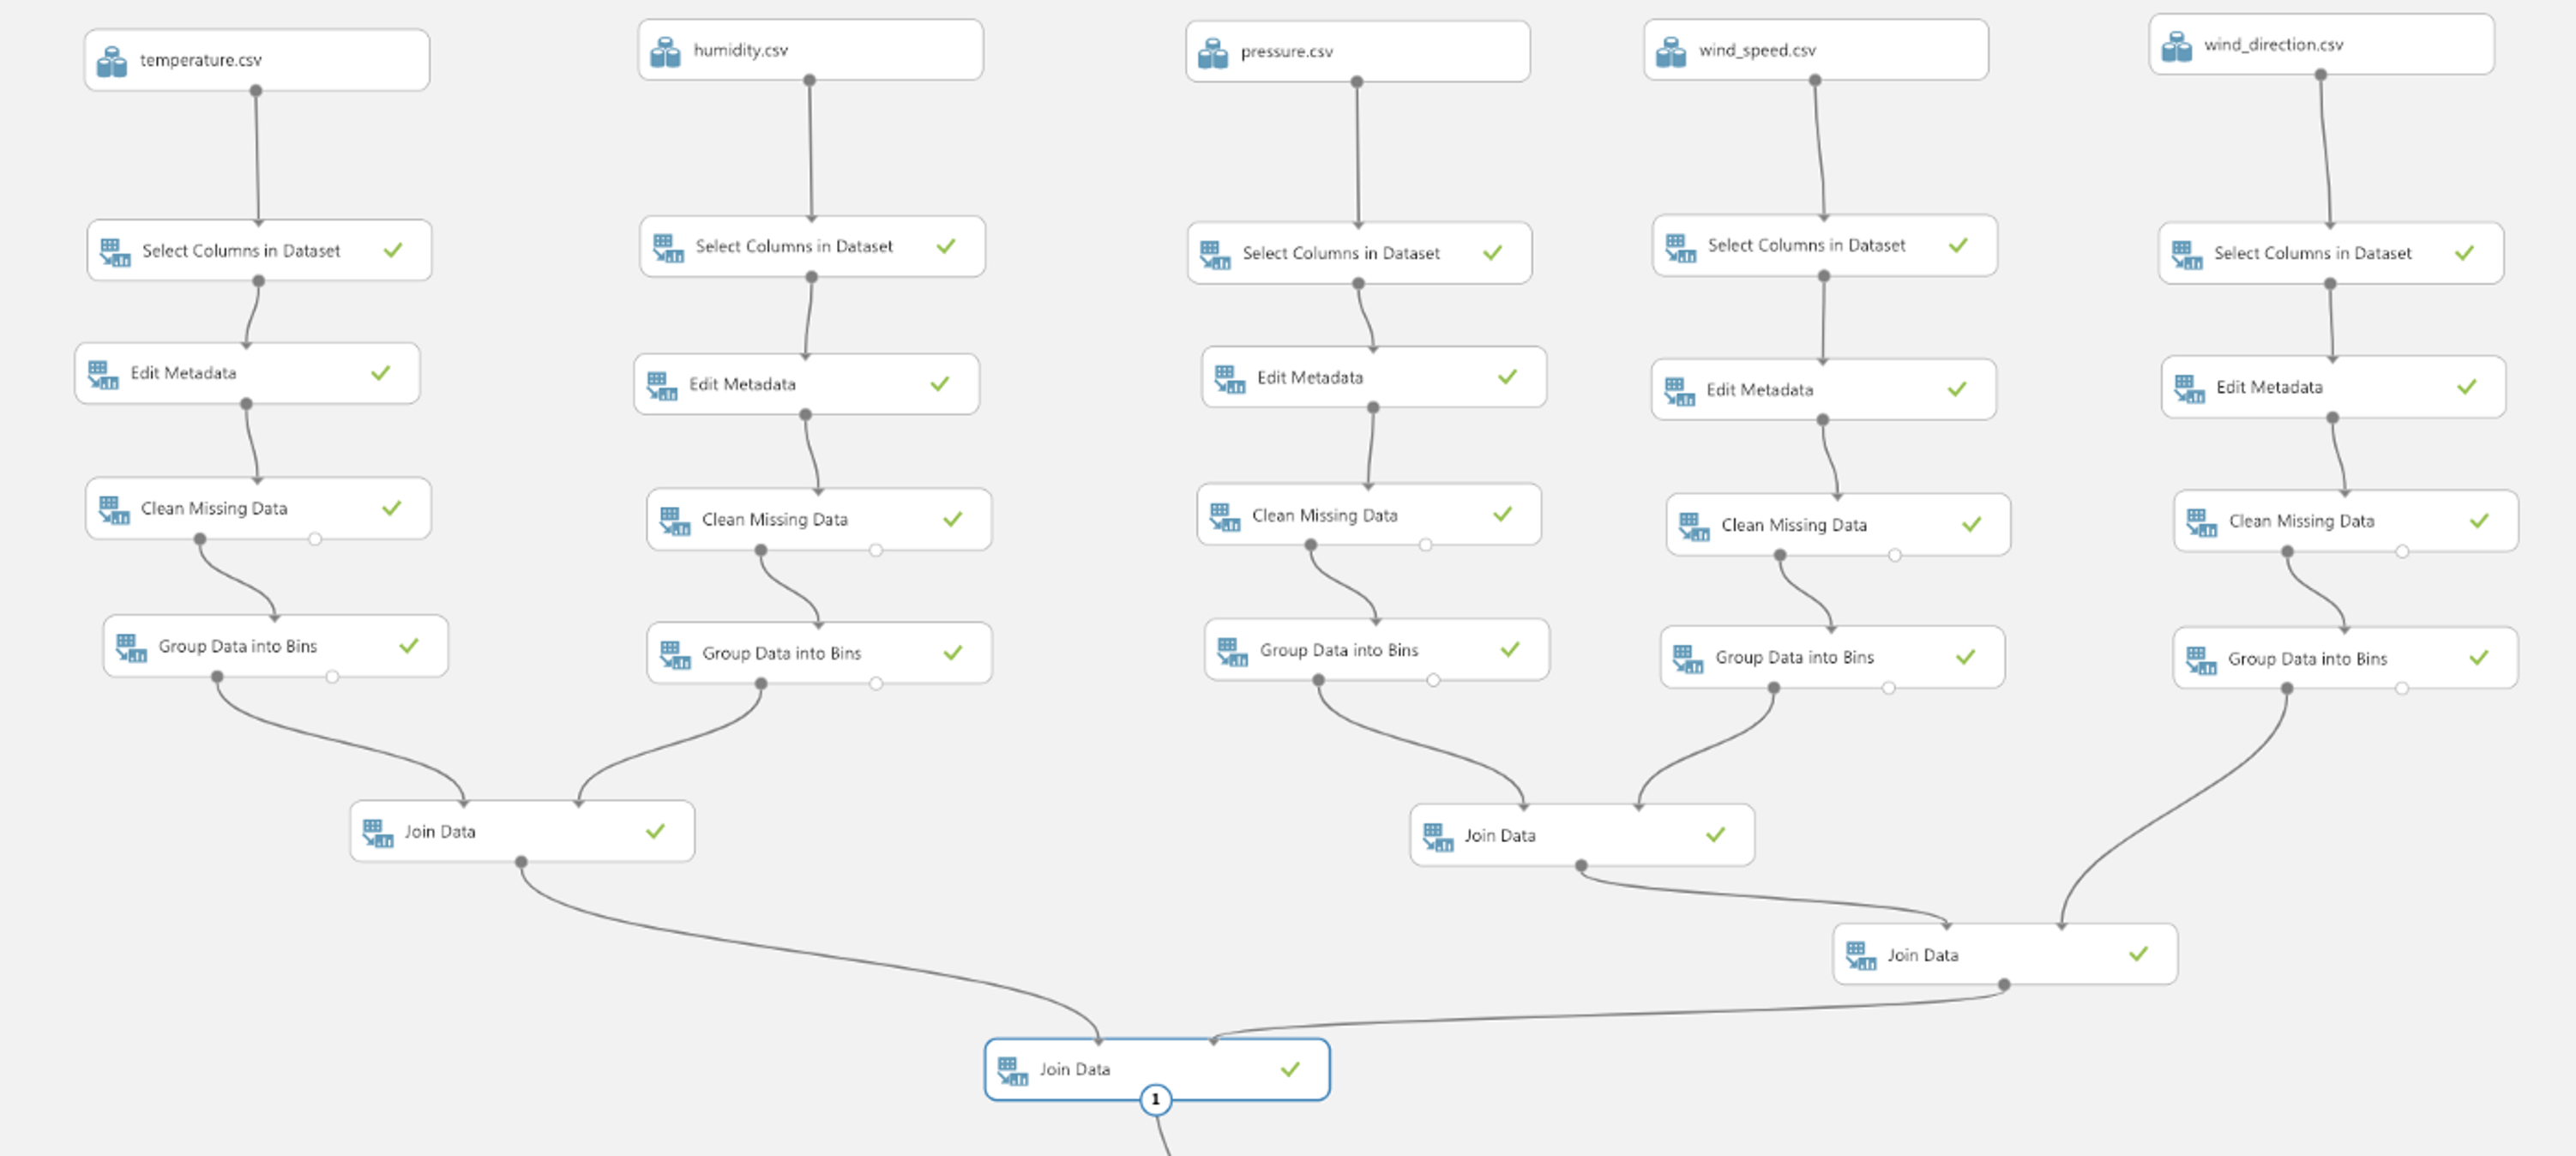
1. Select data: under Data Transformation -> Manipulation drag-and-drop Select Columns in Dataset. In properties, select New York and datetime column using the Launch column selector. Connect a dataset to this module, this would return a data frame that only contains the New York and datetime column. Now do the same for all the datasets.
2. Edit Metadata: the column nameNew Yorkdoesn’t exactly specify what category of data it contains (humidity, temperature etc.). Drag-and-drop the Edit Metadata module. In properties, select the New York column, now you can change its name and other metadata.
3. Clean data: for a large dataset, it’s likely that some data are missing. Missing data could potentially cause problems when training the model. Drag-and-drop the Clean Missing Data module and choose a cleaning mode. Replace with mean usually does the trick with numerical data.
4. Group data: for raw data, it’s better to make it more meaningful by summarizing the entire data into simpler categories or groups, which represents the qualitative or quantitative attributes of the data. Drag-and-drop Group Data into Bins. As for the Binning mode, let’s use the Quantile mode which divides the data into ordered groups of equal sizes. For now, you can input 4 as the Number of bins (play around with this value to see how binning can impact the results).
Data preprocessing should be applied to all the datasets.
Now we need to join the separate datasets in order to train our model. Drag-and-drop 4 Join Data modules to join all 5 datasets together. In properties, the Join key for both L and R is datetime. Let Join type be Inner Join. The reason I didn’t join the datasets right after column selection, is to allow flexibility to change the binning for each column. The steps so far would create an experiment somewhat like the following.

To see the results of Join Data, right-click the module and Run selected. The visualization results will show all 5 weather attribute columns and its corresponding quantized columns. We only need the grouped (quantized) data to train this model, so select only the 5 quantized columns. For Machine Learning, it is a common practice to divide your dataset into 2 subsets; the training set,and the test set.The training set is used to train a model, and the test set is used to test the trained model. Drag-and-drop Split Data, set Fraction of rows in the first output dataset to 0.7, which means 70% of the rows in the dataset will be used for training the model. Check the Randomized split option and set Random seed to a non-negative integer (this is used to initialize the pseudorandom sequence of instances to be used, read more ). As for the training algorithm, let’s use Multiclass Decision Forest. Decision trees are popular classification models while the decision forest is an ensemble of decision trees that can usually provide better coverage and accuracy than single decision trees (read more). Drag-and-drop Multiclass Decision Forest and Tune Model Hyperparameters, connect as follows.
 
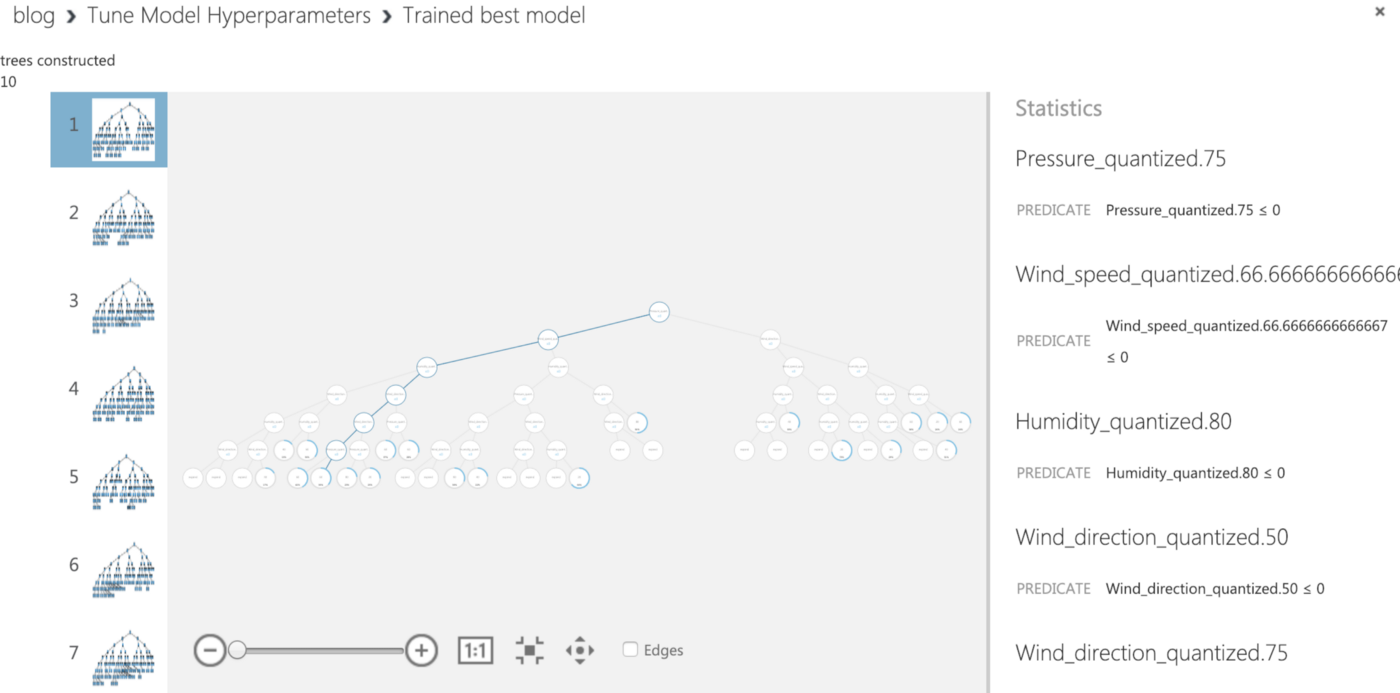
Tune Model Hyperparameters is a module to determine the optimum hyperparameters for a given model. For sweeping mode, Random sweep is quite useful for increasing model performance while conserving computing resources (read more). Increasing the Maximum number of runs on random sweep usually results in a more accurate model but longer training time. Choose a Label column, here we would use Temperature_quantized. Run this current module and right-click Trained best model -> visualize to see the visualization of all trees that were constructed in this decision forest.

Tune Model Hyperparameters is a module to determine the optimum hyperparameters for a given model. For sweeping mode, Random sweep is quite useful for increasing model performance while conserving computing resources (read more). Increasing the Maximum number of runs on random sweep usually results in a more accurate model but longer training time. Choose a Label column, here we would use Temperature_quantized. Run this current module and right-click Trained best model -> visualize to see the visualization of all trees that were constructed in this decision forest.
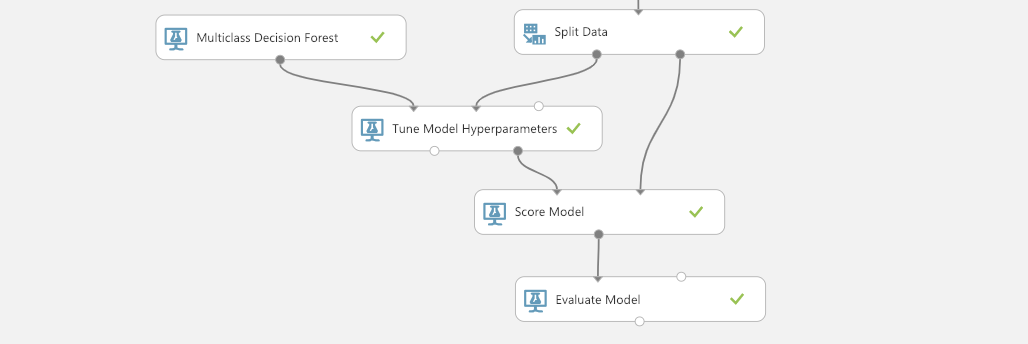
To evaluate the trained model, drag-and-drop Score Model and Evaluate Model module, connect as follows to score the model using test data then evaluate.

To evaluate the trained model, drag-and-drop Score Model and Evaluate Model module, connect as follows to score the model using test data then evaluate.
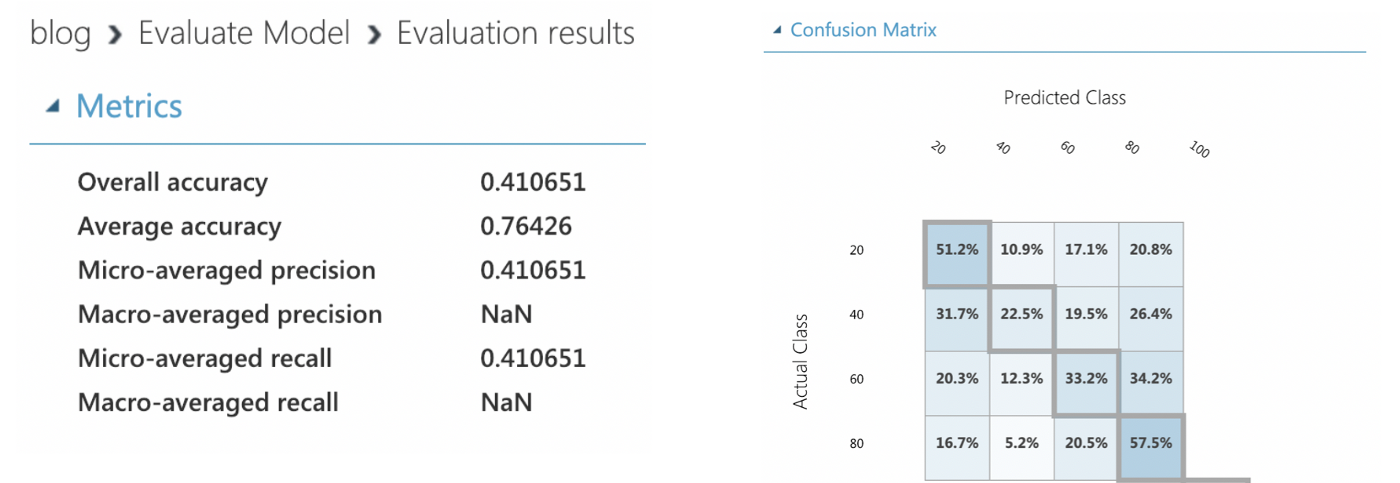
Now you can run Evaluate Model and see evaluation results, which includes the accuracy, precision, and confusion matrix of your trained model.
Do play around with the parameters and variables, and find an optimal model to fit your dataset!
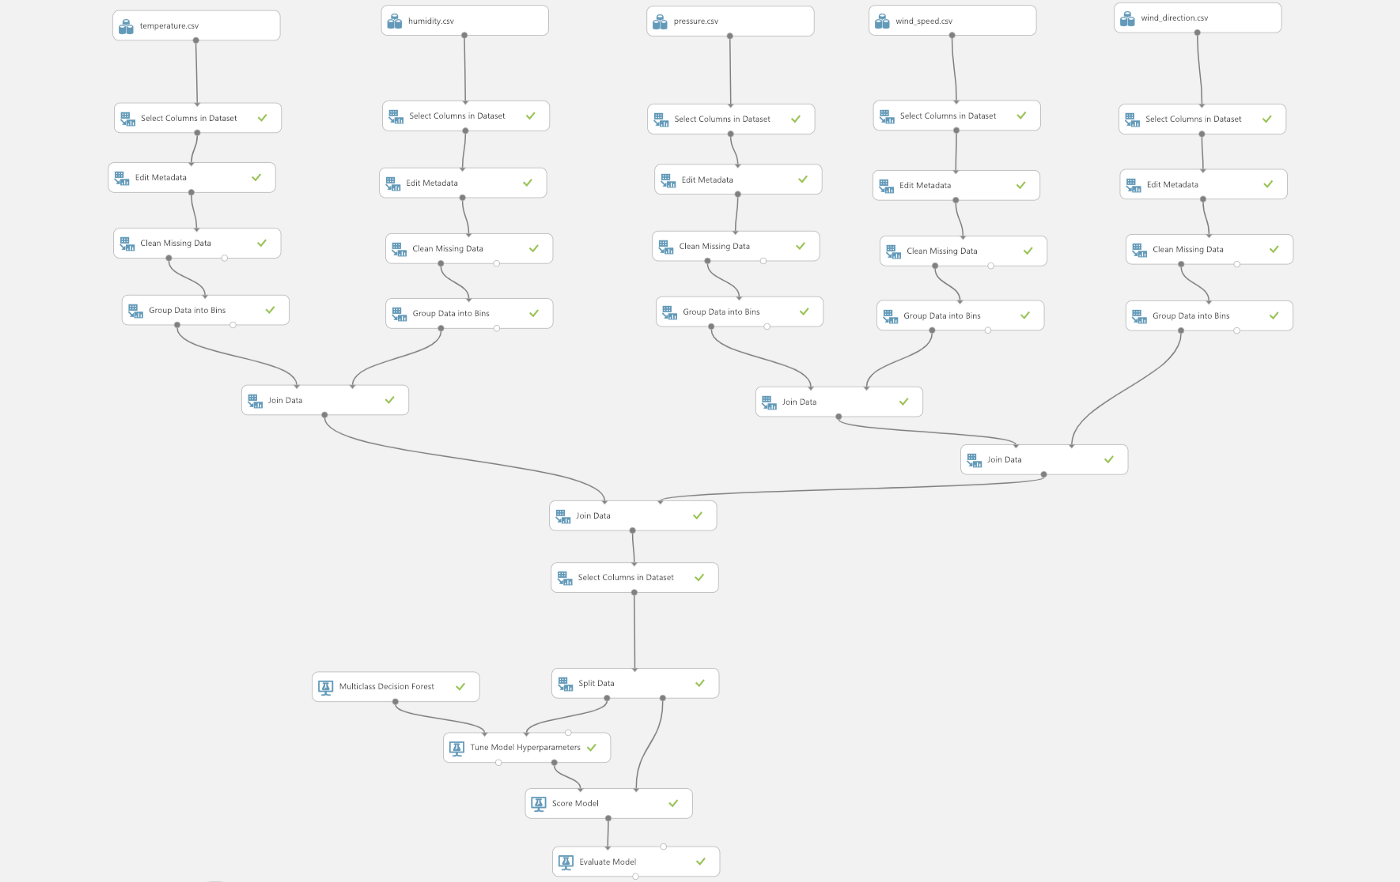
Complete Experiment After building, training and testing this model, you could either set it up as a web service or publish it to the Gallery so more people could see your work! Here’s the link to my experiment . Now, go ahead and start your Machine Learning journey on Azure. Enjoy and hope this was helpful!
Suyan Xu
#coding/tutorial
#include <stdio.h>

int main(void) {
    printf("Contact me!\n");
    return 0;
}
| Purpose | |
|---|---|
| work | suyanaxu@gmail.com |
| academic | suyanx@andrew.cmu.edu |
| just for fun | hi@suyan.dev |